2022. 4. 3. 10:53ㆍ👶 Mini Project/Kaggle

Ubiquant Market Prediction 대회가 열렸다. (사실 개최된지는 꽤... 되었지만)
대회에서 제시하는 문제를 이해하고, 어떻게 문제를 해결할지 고민하고, 실제로 설루션을 제시하는 과정을 천천히 밟아 가보자. Let's Go!
ML from the beginning to the end (For newbies🐢)
Explore and run machine learning code with Kaggle Notebooks | Using data from multiple data sources
www.kaggle.com
[원본 Kaggle kernel] 도움이 되셨다면, Upvote 누르자 >_<
* 해당 포스팅은 문제 이해와 데이터 로딩, 간단한 Take a look을 진행합니다. EDA&FE를 보고 싶다면 다음 포스팅으로!
First. Big Picture - 🏔
To attempt to predict returns, there are many computer-based algorithms and models for financial market trading.
Yet, with new techniques and approaches, data science could improve quantitative researchers' ability to forecast an investment's return.
Ubiquant is committed to creating long-term stable returns for investors.
In this competition, you’ll build a model that forecasts an investment's return rate.
Train and test your algorithm on historical prices. Top entries will solve this real-world data science problem with as much accuracy as possible.
간략하게 말하자면, Ubiquant는 중국의 퀀트(알고리즘으로 투자) 회사입니다. 제공된 데이터를 이용하여 target, 즉 투자 수익률을 예측하는 것이 본 대회가 제시한 문제입니다.
Second. Problem definition -✏
"This dataset contains features derived from real historic data from thousands of investments."
Your challenge is to predict the value of an obfuscated metric relevant for making trading decisions.
- row_id - A unique identifier for the row.
- time_id - The ID code for the time the data was gathered. The time IDs are in order, but the real time between the time IDs is not constant and will likely be shorter for the final private test set than in the training set.
- investment_id - The ID code for an investment. Not all investment have data in all time IDs.
- target - The target.
- [f_0:f_299] - Anonymized features generated from market data.
Performance metrics is the mean of the Pearson correlation coefficient
데이터 내용은 위와 같습니다. 평가 지표는 '피어슨 상관계수' 입니다.
Third. Data & Import
import numpy as np
import pandas as pd
import gc
import matplotlib.pyplot as plt
%matplotlib inline
import tensorflow as tf
from tensorflow.keras import layers
from tensorflow import keras
from scipy import stats
from pathlib import Path
import seaborn as sns
Reading as Parquet Low Memory (Fast & Low Mem Use)https://www.kaggle.com/robikscube/fast-data-loading-and-low-mem-with-parquet-files
⏫ Fast Data Loading and Low Mem with Parquet Files
Explore and run machine learning code with Kaggle Notebooks | Using data from multiple data sources
www.kaggle.com
kaggle은 CPU, RAM을 제한적으로 제공하기 때문에, 이렇게 데이터 크기를 줄일 수 있는 방법을 찾아서 적극 활용해야 합니다. 보통 대회 Notebook 파트를 살펴보시면, 위와 같이 정보를 공유하는 분들이 있으니 참고하시길 바랍니다.
%%time
n_features = 300
features = [f'f_{i}' for i in range(n_features)]
train = pd.read_parquet('../input/ubiquant-parquet/train_low_mem.parquet')
CPU times: user 9.42 s, sys: 15.1 s, total: 24.5 s
Wall time: 39.7 s
start_mem = train.memory_usage().sum() / 1024**2

def decreasing_train(train):
    for col in train.columns:
        col_type = train[col].dtype

        if col_type != object:
            c_min = train[col].min()
            c_max = train[col].max()
            if str(col_type)[:3] == 'int':
                if c_min > np.iinfo(np.int8).min and c_max < np.iinfo(np.int8).max:
                    train[col] = train[col].astype(np.int8)
                elif c_min > np.iinfo(np.int16).min and c_max < np.iinfo(np.int16).max:
                    train[col] = train[col].astype(np.int16)
                elif c_min > np.iinfo(np.int32).min and c_max < np.iinfo(np.int32).max:
                    train[col] = train[col].astype(np.int32)
                elif c_min > np.iinfo(np.int64).min and c_max < np.iinfo(np.int64).max:
                    train[col] = train[col].astype(np.int64)
            else:
                if c_min > np.finfo(np.float16).min and c_max < np.finfo(np.float16).max:
                    train[col] = train[col].astype(np.float16)
                elif c_min > np.finfo(np.float32).min and c_max < np.finfo(np.float32).max:
                    train[col] = train[col].astype(np.float32)
                else:
                    train[col] = train[col].astype(np.float64)
        else:
            train[col] = train[col].astype('category')
    return train

train = decreasing_train(train)
end_mem = train.memory_usage().sum() / 1024**2
print('Memory usage after optimization is: {:.2f} MB'.format(end_mem))
print('Decreased by {:.1f}%'.format(100 * (start_mem - end_mem) / start_mem))
Memory usage after optimization is: 1915.96 MB
Decreased by 47.4%
Fourth. Take a looke and Split test data -🙄
display(train.info())
display(train.head())
<class 'pandas.core.frame.DataFrame'>
RangeIndex: 3141410 entries, 0 to 3141409
Columns: 304 entries, row_id to f_299
dtypes: category(1), float16(303)
memory usage: 1.9 GB
for i in ['investment_id', 'time_id']:
    print(f'------------------{i} / value counts------------------')
    display(train[i].value_counts())
------------------investment_id / value counts------------------

2752.0    3576
3052.0    3528
3304.0    3516
2356.0    3514
2712.0    3510
          ...
85.0         8
905.0        8
2558.0       8
3662.0       7
1415.0       2
Name: investment_id, Length: 2788, dtype: int64
------------------time_id / value counts------------------
1214.0 3445
1209.0 3444
1211.0 3440
1207.0 3440
1208.0 3438
...
415.0 659
362.0 651
374.0 600
398.0 539
492.0 512
Name: time_id, Length: 1211, dtype: int64
train.head()

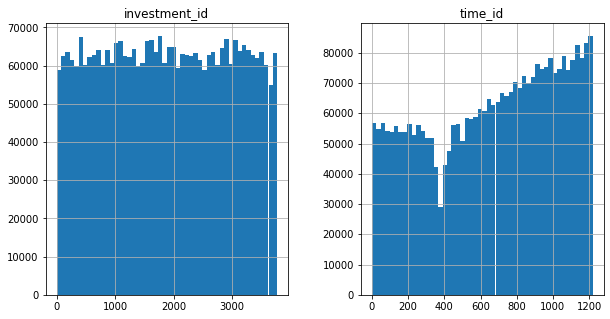
train[['investment_id', 'time_id']].hist(bins=50, figsize=(10,5))
plt.show

380-410(time_id) are strange and You can see time_id's increasing aspect
Split Test data
We will split data based on time_id category [stratified sampling]
for preventing sampling bias
본격적인 데이터 분석을 하기 전, 미리 train data와 test data를 나눠줍니다.
from sklearn.model_selection import StratifiedShuffleSplit

split = StratifiedShuffleSplit(n_splits=1, test_size=0.2, random_state=42)
for train_index, test_index in split.split(train, train['time_id']):
    train_set = train.loc[train_index]
    test_set = train.loc[test_index]
test_x = test_set.drop(['target', 'row_id'], axis=1).copy()
test_target = test_set['target'].copy()
display(train_set['time_id'].value_counts() / len(train_set))
display(test_set['time_id'].value_counts() / len(test_set))
1214.0    0.001097
1209.0    0.001096
1211.0    0.001095
1207.0    0.001095
1208.0    0.001094
            ...
415.0     0.000210
362.0     0.000207
374.0     0.000191
398.0     0.000171
492.0     0.000163
Name: time_id, Length: 1211, dtype: float64
1214.0 0.001097
1209.0 0.001097
1207.0 0.001095
1211.0 0.001095
1219.0 0.001095
...
415.0 0.000210
362.0 0.000207
374.0 0.000191
398.0 0.000172
492.0 0.000162
Name: time_id, Length: 1211, dtype: float64
del train
del test_set
'👶 Mini Project > Kaggle' 카테고리의 다른 글
| [Kaggle] Ubiquant Market Prediction, 금융데이터 예측 - Part 3 (0) | 2022.04.03 |
|---|---|
| [Kaggle] Ubiquant Market Prediction, 금융데이터 예측 - Part 2 (0) | 2022.04.03 |